As you use our software, you may find it useful to compare your school’s applied plans and SEN support pupils with the national average. Please note that this feature is only available for schools in England.
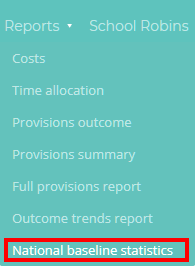
To view National Baseline Statistics in Provision Map, mouse over the Reports tab along the top of the page and select National Baseline Statistics from the list of available options.
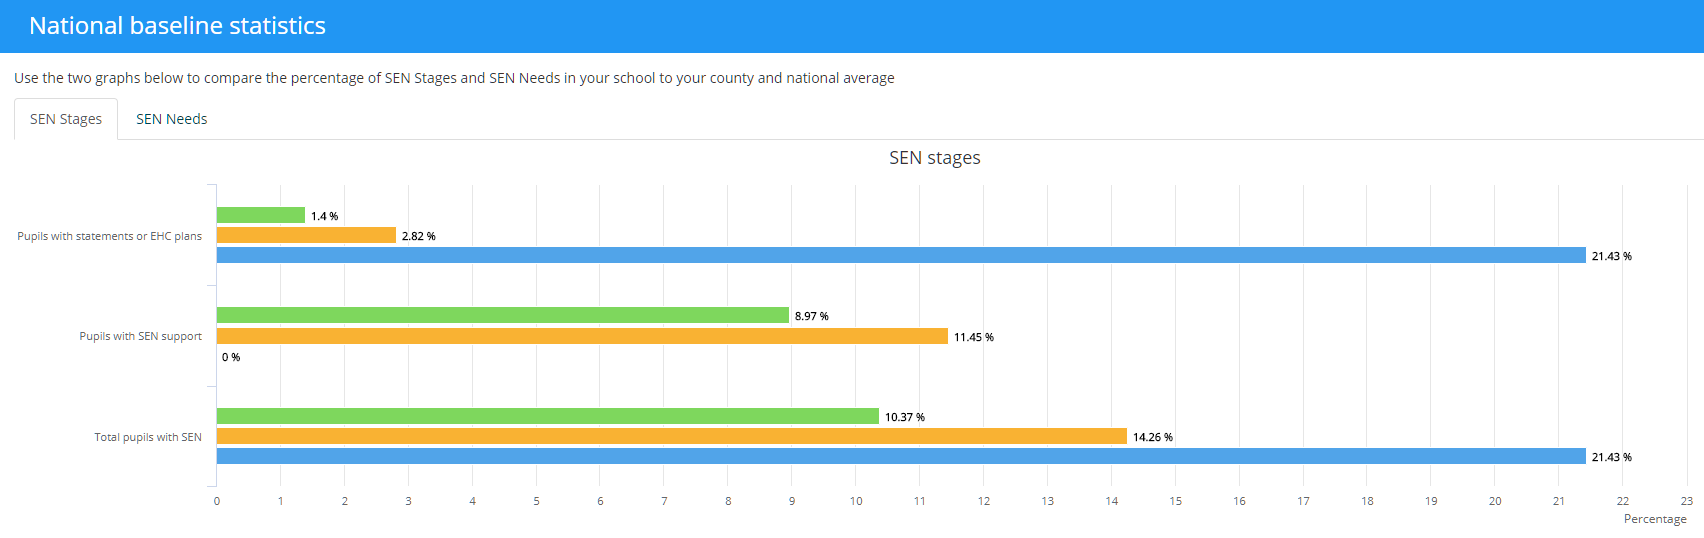
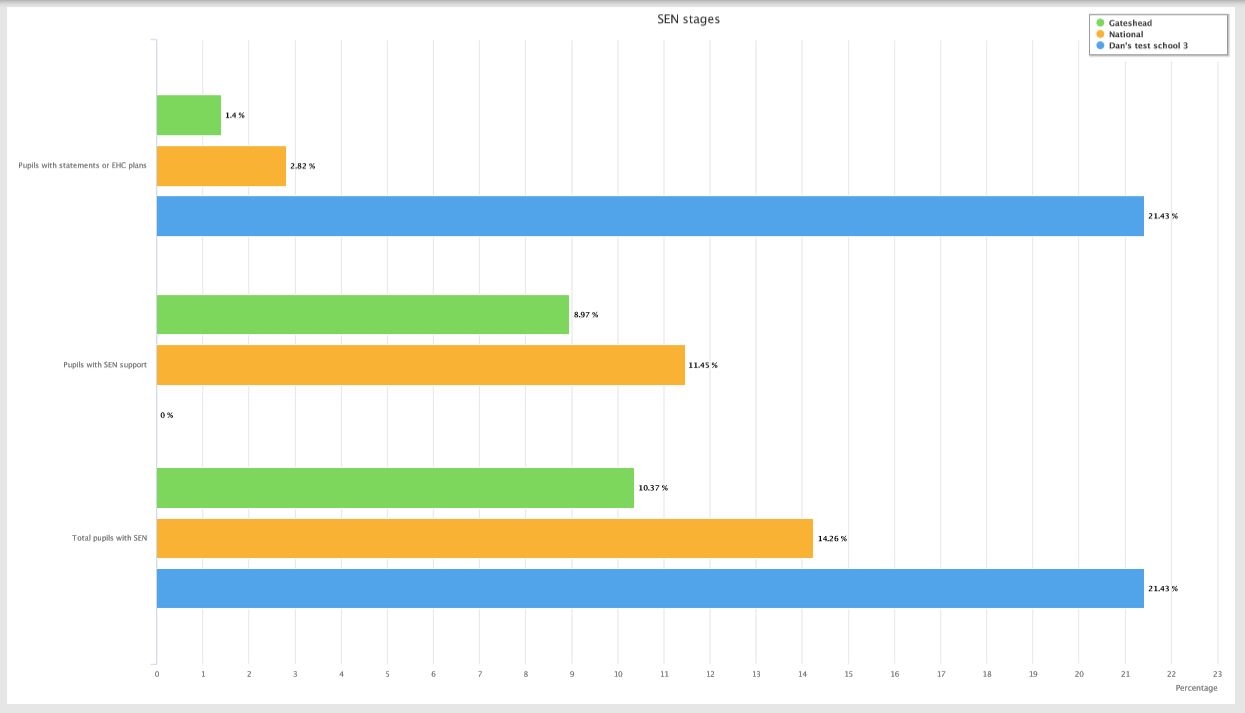
You will be presented with a graph similar to the one shown below. Here, the percentage of pupils with EHC plans and SEN support are compared to the national average.
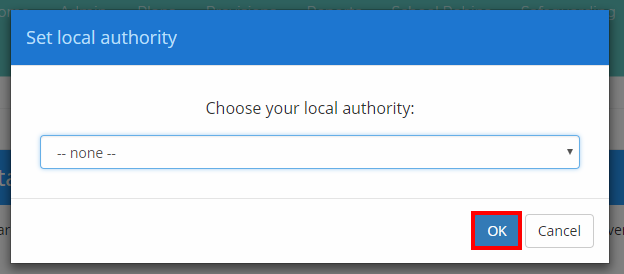
If this is the first time your school has accessed the National Baseline Statistics page, you will be prompted to select a local authority to compare your school against.
Select an LA from the drop down menu and click on the OK button.
The legend for the graph can be seen on the right hand side, which is broken down as follows:

Green: This part of the graph represents the local authority (if applicable).
Yellow: This part of the graph represents the national average.
Blue: This part of the graph represents your school.
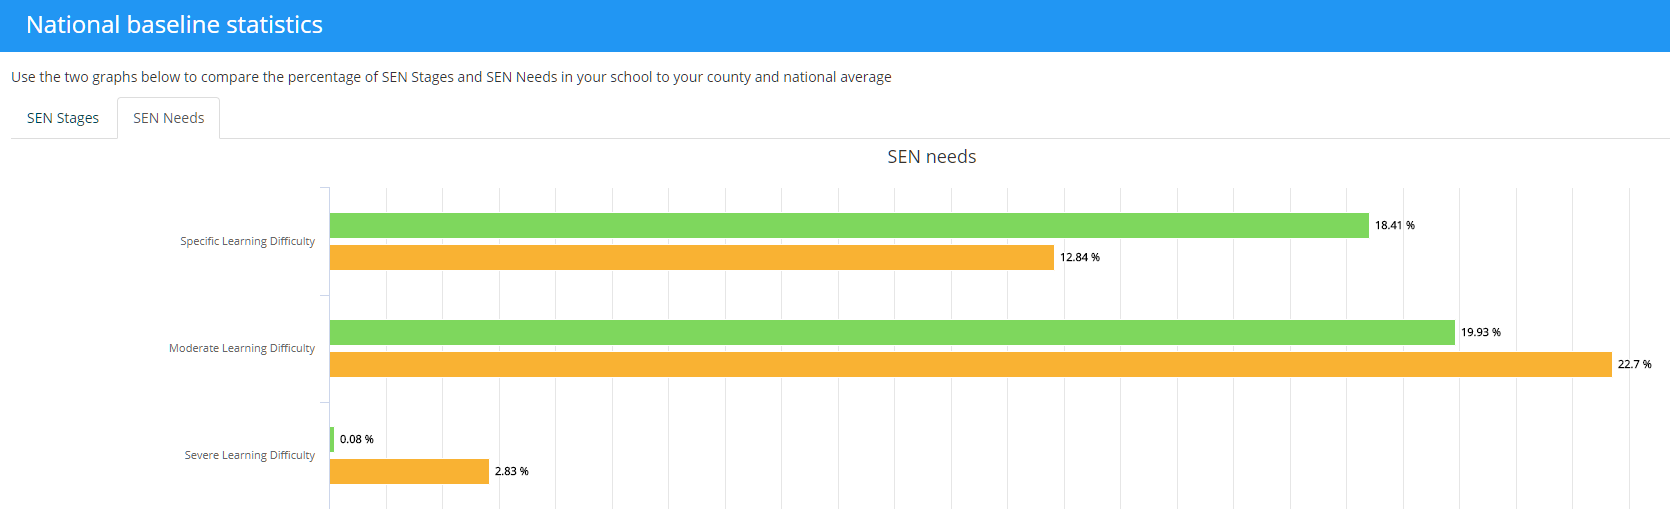
Viewing national baseline statistics for SEN needs
To view the National Baseline Statistics for SEN needs, click on the SEN Needs tab above the graph.
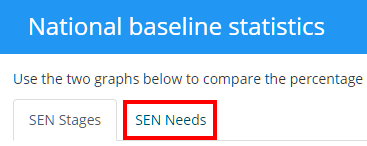
The graph will now display a comparison between your school and the national average for each SEN need.
Printing the national baseline statistics graph
To print the SEN stages or SEN needs graph, click on the Print button in the top right hand corner of the page.

A printable pdf copy of the selected SEN graph will be generated.
Change the displayed Local Authority
To choose a different LA to compare your school against, click on the Choose LA button in the top right hand corner of the page.

The Set local authority popup will appear. Select a local authority from the drop down menu and click on the OK button.
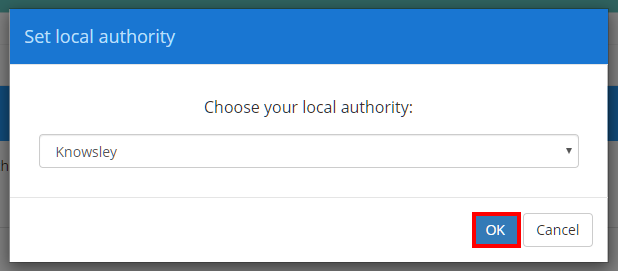
The National Baseline Statistics graphs will now be updated with the new local authority.
Configure SEN stage categories
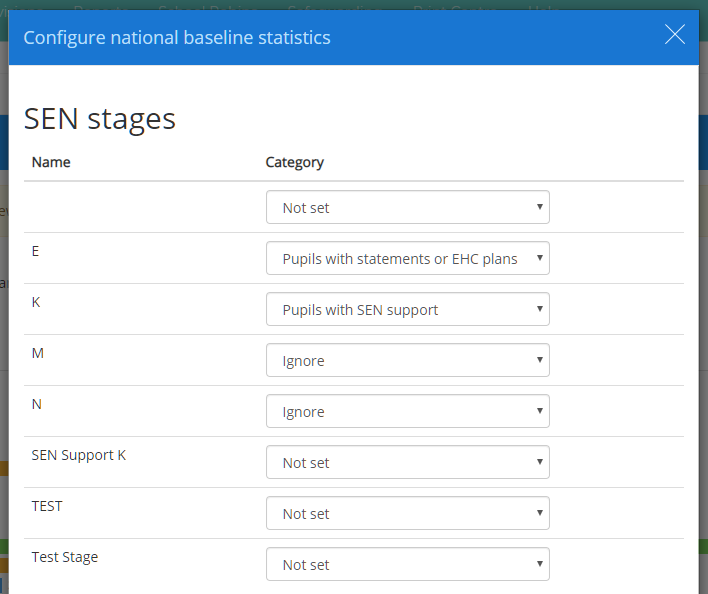
To change how SEN stages should count towards your school’s percentages, click on the Configure SEN stages button.

The Configure national baseline statistics popup will appear. Click on the drop down menus provided to control which stages should be included for each SEN stage category.
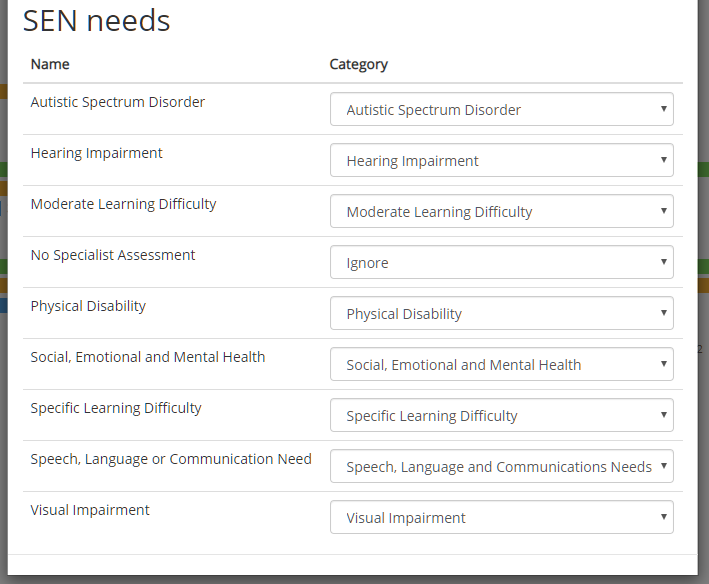
If your school has chosen to display SEN needs in your school, you can also control how SEN needs contribute your school’s percentage for the selected SEN need category.