As safeguarding concerns are reported through Safeguard my School, it may be vital to start tracking how concerns are being opened and closed over the years in order to determine trends in reporting.
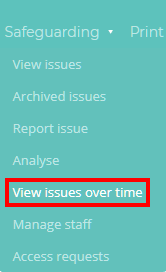
To access a graph depicting how safeguarding concerns are reported at your school, mouse over the Safeguarding tab at the top of the page and select View concerns over time from the list of available options.
You will be presented with a graph similar to the one shown below, where the number of concerns is displayed on the Y axis and time is displayed the X axis.
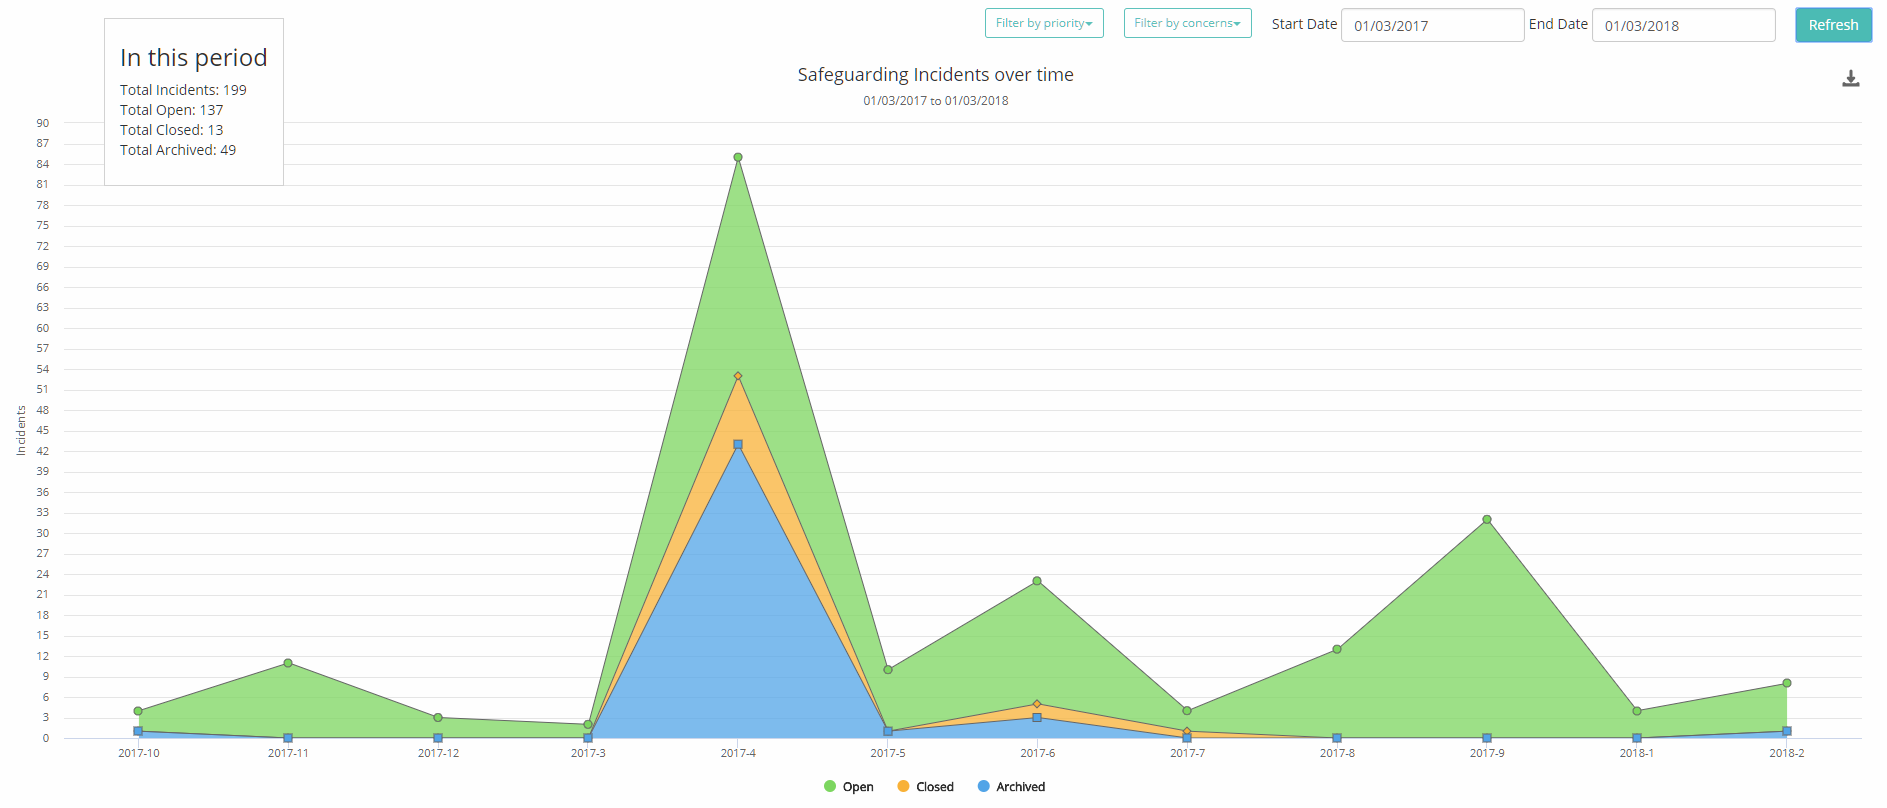
The available status categories for safeguarding concerns are colour coded as follows:
- Open: Green
- Closed: Yellow
- Archived: Blue
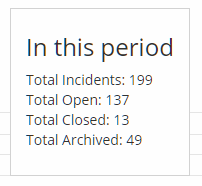
In the top left hand corner of the page, the total number of concerns for each status category are logged for the graph’s applied date range.
To generate a printable PDF copy of the safeguarding graph, click on the download icon to the right of the graph and select Print from the popup menu.

Filtering the safeguarding graph
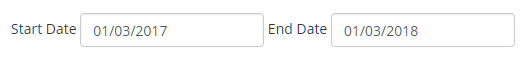
To change the date range that the safeguarding graph covers, click on the Start Date and End Date date pickers in the top right hand corner of the page.
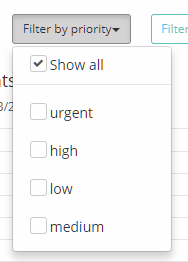
To filter the graph by a specific priority level, click on the Filter by priority drop down menu and tick the priority level of your choice.
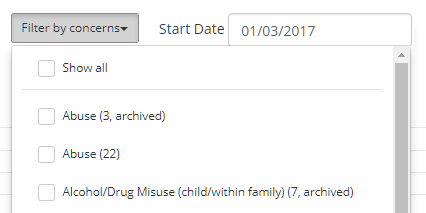
To filter the graph by a specific concern category, click on the Filter by concerns drop down menu and tick the safeguarding concern categories of your choice.
Once the date range and filter options have been changed, click on the Refresh button to apply the changes to the graph
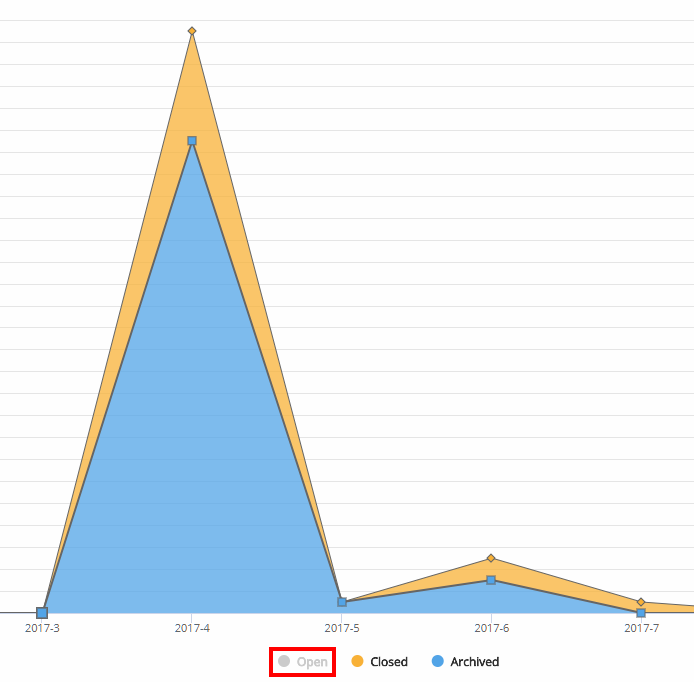
Limiting status categories on the safeguarding graph
You can also toggle displaying status categories on/off by clicking on the chosen category in the legend below the graph.