If your school also holds an active Class Charts license with the Behaviour module, you will be able to display Class Charts behaviour information for each pupil in Provision Map. Please note: You will need to contact us first in order to link your school’s Class Charts and Provision Map accounts together.
To enable Class Charts behaviour in Provision Map, mouse over the Admin tab and select School settings from the drop down menu.

Next, scroll down to the School Details section or click on the School Details option in the navigation menu on the left hand side of the screen.
![]()
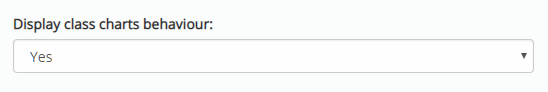
Finally, set the Display Class Charts behaviour setting to Enabled.
Viewing Class Charts behaviour data in Provision Map
Now that Class Charts behaviour has been set to display in Provision Map, behaviour data for each pupil will now be available to view.
To view behaviour data for a specific pupil, mouse over the Admin tab and select Pupil details from the drop down menu.

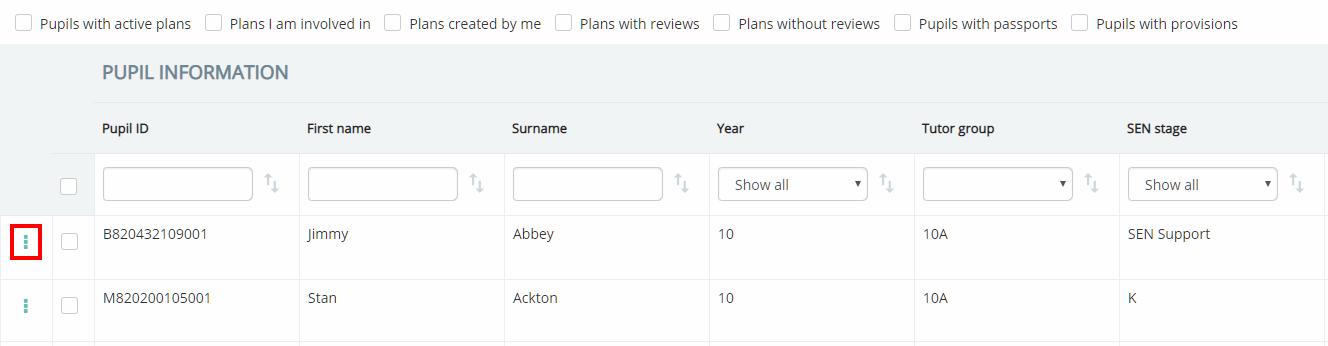
You will be presented with a list of pupils that are currently enrolled at your school. Click on the three dots menu for the pupil of your choice.
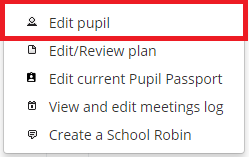
Next, select Edit pupil from the popup menu.
You will now be redirected to the pupil’s profile, where core information about the pupil is listed.
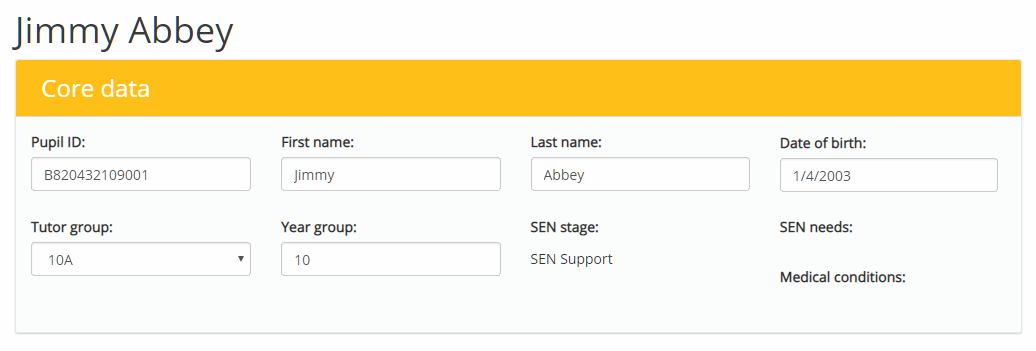
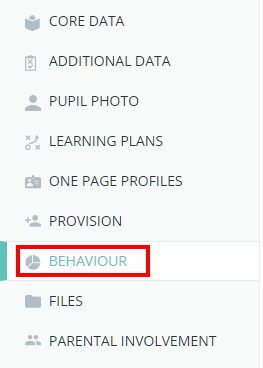
Scroll down to the Behaviour section of the pupil profile, or select Behaviour from the navigation menu on the left hand side.
The Behaviour section displays a pupil’s Class Charts behaviour data for the past three months. This behaviour data is represented in the form of several breakdown graphs, showing how behaviour was recorded each month and between classes.

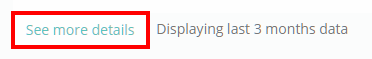
To view the behaviour information in more detail, click on the See more details button at the bottom of the section. This will take you to the Class Charts login page.